Last updated May 2026.
In the fast-paced world of ecommerce and CPG, having cash locked in the wrong inventory isn’t just inconvenient, it can stall growth. Companies that effectively track inventory turnover stay well-stocked, minimize waste, and unlock opportunities for expansion. Knowing how products move, where capital is tied up, and how to optimize restocking has become critical for scaling successfully.
For ecommerce and CPG brands moving tens of thousands of units each month, inventory turnover is more than a simple metric, it’s a key lever for managing cash flow, improving operational efficiency, and supporting frictionless growth. With a thoughtful tracking approach, businesses can prevent stockouts, free up working capital, and make more informed decisions for expansion.
What Is Inventory Turnover & Why It’s Important
Inventory turnover measures how much stock an ecommerce or CPG brand consumes over a given period. It’s more than simply counting units, it’s a critical metric that provides insight into cash flow, operational efficiency, customer satisfaction, and forecasting accuracy. When tracked correctly, inventory turnover becomes a lens for understanding how effectively your stock is moving through your business and where opportunities exist to optimize working capital.
Accurate inventory turnover data helps drive accurate inventory turnover calculations.
Inventory Turnover (also called inventory velocity, inventory turns, Days Inventory Outstanding or inventory turnover, days of supply, weeks of supply) can be calculated in two ways - by units and by dollars - each calculation has its own valuable purpose.
Inventory Turnover (units) = Total units of inventory on hand / average daily or weekly sales of the same SKU in units. Eg. If I have 1,000 units on hand and over the past 3 months I have sold 5 units / day - my inventory turnover in units is 1,000 / 5 = 200 days or 28.5 weeks.
Inventory Turnover (dollars) = Total dollar value of inventory on hand / average daily or weekly COGS of the same SKU in dollars. E.g., if the 1,000 units have a Landed cost of $5,50 / unit and sell for an average of $13 / unit - my inventory turnover in dollars is (1,000 units * $5.50) / (5 units / day * $5.50 / unit) = 200 days
The two calculations will yield the same result for an individual SKU, but can yield useful differences across a collection of SKUs with different sales velocities and margins. Inventory Turnover (dollars) is most often used when analyzing financial statements when unit balances aren’t available.
Accurate inventory turnover insights enable brands to:
- Prevent stockouts: By analyzing daily or weekly sales trends, brands can keep their top-selling items consistently available. Avoiding stockouts builds customer trust, boosts retention, and maintains strong marketplace metrics.
- Reduce excess inventory costs: Slow-moving stock ties up cash and increases storage expenses. Monitoring turnover helps maintain lean inventory without risking availability, freeing capital for initiatives like marketing campaigns, new product launches, or expanding into additional sales channels.
- Make smarter purchasing decisions: Turnover data guides order planning and demand forecasting. Brands can adjust inventory based on seasonal trends, promotions, or regional demand, minimizing guesswork and reducing the risk of misaligned stock.
Practical Example: A midmarket ecommerce or CPG brand selling specialty energy bars across DTC, Amazon, and regional retail partners sees monthly demand fluctuating from 5,000 to 12,000 units depending on promotions and seasonality. The units have a Landed Cost of $3.50 / unit. Without tracking inventory turnover, the brand might overstock 15,000 units “just in case,” tying up cash unnecessarily. By analyzing daily turnover by SKU and fulfillment center, they discover which flavors sell fastest online versus in stores, identify regional demand spikes, and pre-stage inventory ahead of short-term promotions. This allows them to reduce total stock to 9,000 units, allocate products strategically, cut emergency shipping costs, and free up $21,000 of working capital to reinvest in marketing or new product launches — all while keeping customers in stock and satisfied.
Broader Operational Impact:Beyond cash flow, tracking turnover improves operational efficiency. Accurate data can:
- Minimize emergency orders and expedited shipping costs.
- Enhance warehouse labor planning by predicting pick volumes.
- Feed into automated reorder points to streamline replenishment.
- Provide accurate reporting for investors, CFOs, or board members seeking insight into inventory capital.
By linking turnover metrics to both financial and operational planning, businesses can balance inventory and cash, enabling faster, smarter decisions that drive sustainable growth.
Business Impacts Every eCommerce and CPG Operator Should Understand
Inventory turnover isn’t just another number on a spreadsheet, it has a direct impact on a brand’s profitability, operational efficiency, and customer satisfaction. When tracked effectively, turnover data empowers businesses to make informed decisions, avoid costly errors, and seize growth opportunities.
- Balance stock to reduce shortages and excess: Reliable turnover insights help ecommerce and CPG brands maintain optimal inventory levels. Preventing stockouts keeps high-demand products available, protecting revenue and building customer trust. Conversely, monitoring turnover helps avoid excess inventory sitting idle in warehouses, lowering storage costs and freeing cash for marketing, new product launches, or business expansion.
- Support retention and meet marketplace expectations: Brands selling across multiple channels need consistent inventory to meet marketplace service-level agreements (SLAs) and keep customers happy. Running out of stock can negatively affect seller ratings on platforms like Amazon or Walmart, while reliable fulfillment strengthens brand reputation and encourages repeat purchases.
- Avoid B2B penalties: Wholesale and retail partners may charge fees for late or incomplete shipments. Using turnover data to forecast demand and allocate stock effectively allows businesses to maintain high fill rates, prevent fines, and foster strong, lasting relationships with retail and distribution partners.
Category Considerations
Each product category benefits from a tailored approach to tracking inventory turnover:
Beauty & Skincare: Limited-edition items, seasonal releases, and expiration dates make precise tracking critical. Ordering too much leads to waste, while ordering too little risks missing revenue during peak demand.
Food & Beverage: Perishable goods require strict FIFO (first-in, first-out) or FEFO (first-expiring, first-out) practices. Even small errors can result in spoilage, write-offs, and lost customer trust.
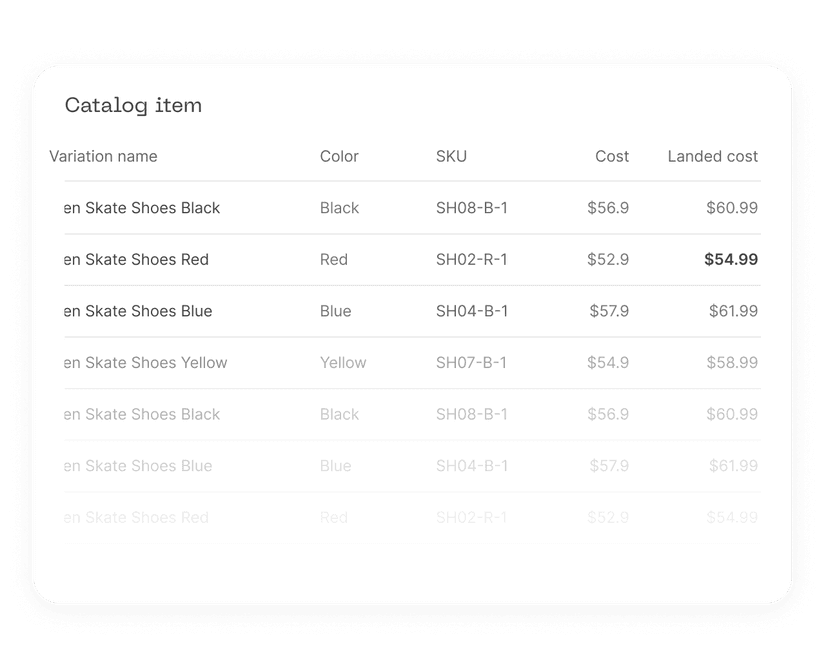
Apparel: With numerous SKUs across sizes, colors, and styles, minor miscalculations in turnover can cause markdowns or missed sales. Knowing which variations sell fastest ensures shelves, and ecommerce listings, are always stocked with the right products.
By monitoring turnover at both the category and SKU level, brands can better allocate stock across fulfillment centers, minimize waste, and keep high-demand products readily available. This approach not only boosts profitability but also strengthens operational efficiency, customer satisfaction, and long-term growth.
Signs Your Inventory Turnover Tracking May Be Falling Short
Even seasoned operators can lose sight of inventory without reliable turnover data. If your ecommerce or CPG business is operating without clear supply chain visibility, warning signs often surface in daily operations and financial results.
- Frequent emergency orders or expedited shipments: Constantly placing last-minute orders to prevent stockouts indicates turnover isn’t being monitored effectively. These rush shipments drive up costs and create stress for warehouse teams and fulfillment partners.
- Large write-offs for expired, damaged, or obsolete stock: Misjudging demand or failing to manage stock rotation can result in products that spoil, expire, or become unsellable. Such losses tie up cash and reduce overall profitability, often hiding inefficiencies that better turnover tracking could resolve.
- Discrepancies between warehouse inventory and spreadsheets or ERP reports: When physical stock doesn’t match your records, it highlights gaps in tracking. These inconsistencies can lead to poor purchasing decisions, missed sales, and inaccurate financial reporting.
- Uneven stock across multiple fulfillment centers: Businesses with several warehouses may see imbalanced inventory, where some locations run out while others hold excess. This not only increases shipping costs but also risks lost sales.
- Recurring customer complaints about out-of-stock items: Frequent stockouts harm trust, reduce retention, and damage brand reputation. Often, these issues stem from weak turnover tracking rather than unpredictable demand.
Why it matters: Catching these warning signs early helps prevent lost revenue, operational inefficiencies, and strained supplier relationships. Brands that address gaps in inventory tracking can cut costs, improve fulfillment reliability, and build a stronger foundation for scalable growth.
Formulas to Calculate Inventory Turnover With Confidence
Precise calculations are the backbone of effective inventory management. Knowing how much stock moves, when it moves, and where it moves helps ecommerce and CPG brands make smarter decisions around purchasing, fulfillment, and cash flow. Begin with straightforward SKU-level calculations, then aggregate them into weekly, monthly, or seasonal periods for a full picture of inventory performance.
Core Formulas
- Daily Turnover = Units Sold ÷ Number of Days in PeriodThis metric reflects the average number of units sold per day. Monitoring daily turnover over time helps businesses anticipate demand, plan restocking, and detect unusual sales spikes or slowdowns.
- Days on Hand = Current Inventory ÷ Daily TurnoverAlso referred to as inventory turnover in days, this shows how long your existing stock will last based on current sales patterns. It’s vital for avoiding stockouts or overstock, especially during peak seasons or promotions.
- Reorder Point = (Daily Turnover × Lead Time) + Safety StockThe reorder point indicates when a new order should be placed to prevent running out. Including lead time (supplier delivery duration) and safety stock (buffer for unexpected demand) ensures replenishment happens reliably.
Pro Tips for Accurate Calculations
- Adjust formulas for different fulfillment models: DTC single-unit shipments behave differently than wholesale case packs. Tailoring calculations by channel improves accuracy.
- Track by fulfillment center: Brands with multiple locations should monitor consumption per warehouse to spot regional demand trends and optimize stock placement.
- Watch SKU-level trends and seasonality: Turnover fluctuates. Track fast and slow movers as well as seasonal changes to prevent unexpected stock issues or capital lockup.
- Integrate with reporting tools: Linking these calculations to inventory management software reduces manual errors and provides real-time insights for faster, data-driven decisions.
3 Approaches to Track Inventory Turnover for eCommerce and CPG Brands
Monitoring inventory turnover can range from simple manual methods to fully automated solutions. The best approach depends on your business size, SKU complexity, and fulfillment strategy.
1. Pen-and-Paper or Basic Spreadsheets
- Pros: Low-cost, quick to implement, and ideal for small businesses or startups with a limited number of SKUs.
- Cons: Susceptible to data entry errors, version control challenges, and lacks real-time visibility. As order volumes grow, maintaining spreadsheets becomes cumbersome and error-prone.
- Tip: Lock formula cells, use data validation to prevent mistakes, and set conditional formatting to highlight low stock. You can also link Google Sheets or Excel to your ecommerce platform exports for semi-automated tracking.
2. Inventory Management Software (IMS) or ERP Systems
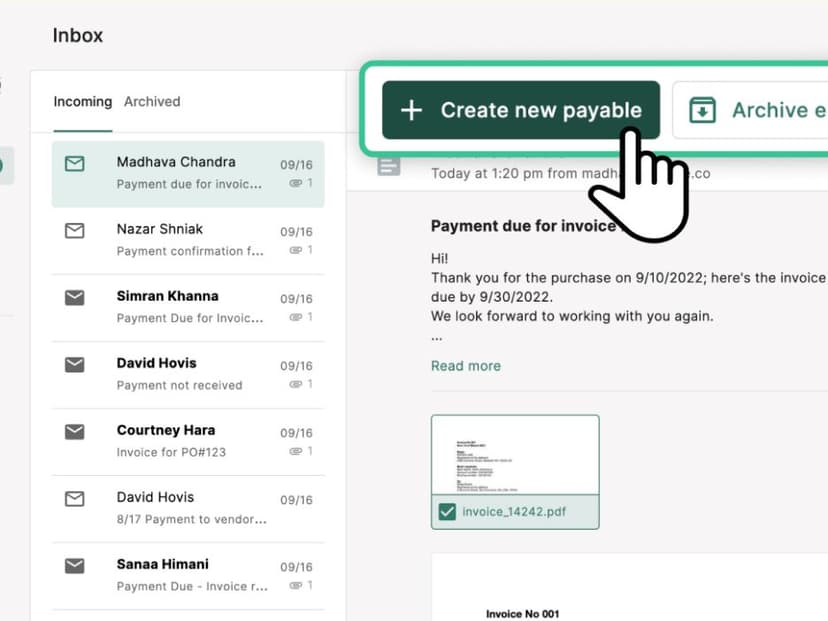
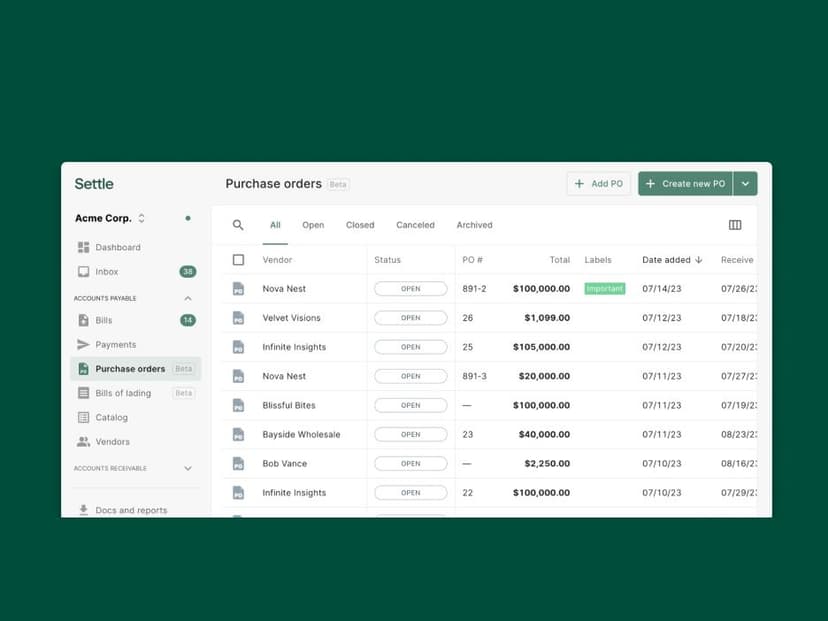
In a fast-paced ecommerce or CPG business, inventory management software does more than track stock — it calculates margins, optimizes fulfillment, and delivers actionable insights. With features like real-time monitoring, automated purchase orders, cost tracking, and demand forecasting, these tools help prevent overstock and stockouts while keeping inventory synchronized across all channels. Consider it an operational co-pilot that keeps products moving, available, and profitable.
Key Features to Consider:
- Real-Time Inventory Tracking: Keep stock levels accurate across warehouses, online stores, and marketplaces.
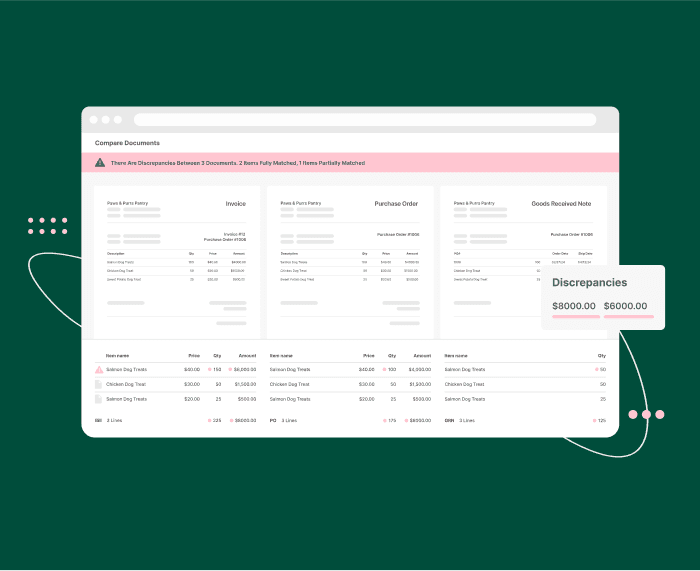
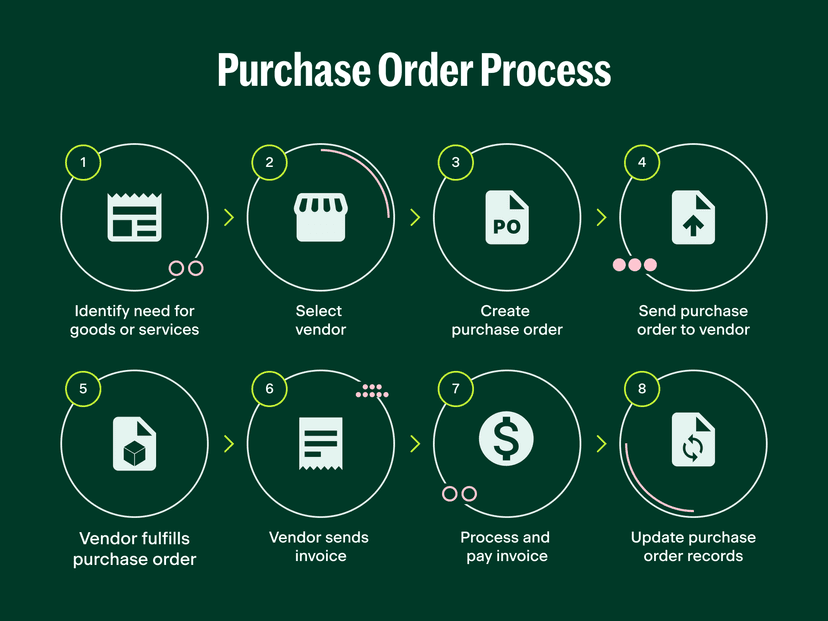
- Streamlined Purchase Orders and Receiving: Automate POs, track multiple shipments, and hold vendors accountable.Automated Three-Way Match: Compare POs, invoices, and receipts instantly to catch discrepancies.
- Multi-Channel Sync: Maintain consistent inventory across Shopify, Amazon, Walmart, TikTok, and more.
- Demand Forecasting & Analytics: Predict sales and adjust inventory based on historical trends and market insights.
- Embedded Payments: Monitor gross margin, COGS, and inventory valuation in real time, simplifying bookkeeping.
- Reporting & Insights: Access dashboards that highlight sales, SKU performance, and turnover trends.
- Free Starter Plans: Many platforms offer free starter tiers, allowing small ecommerce sellers to get started easily and cost-effectively.
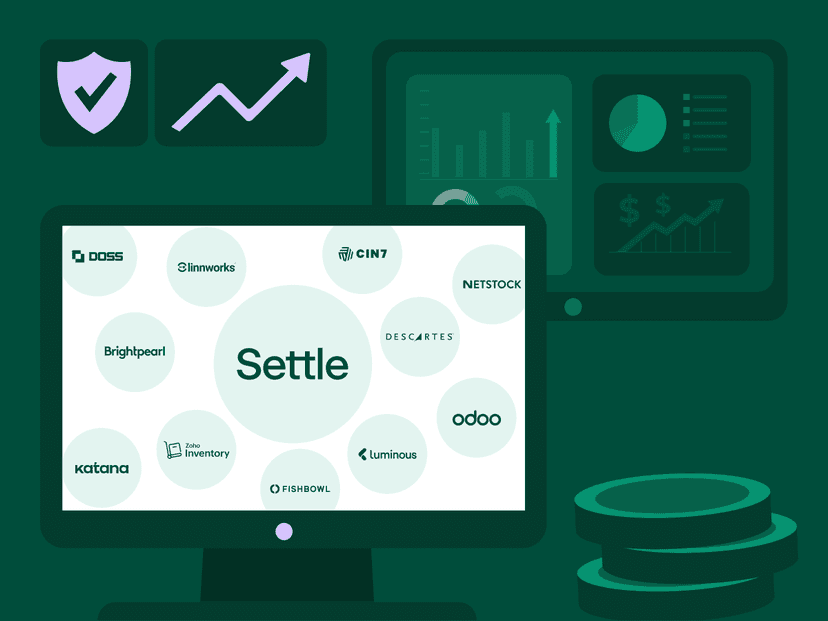
For guidance on selecting the right platform, see the 2026 guide to the 12 best inventory management software providers for ecommerce brands.
3. Third-Party Logistics (3PL) Analytics for Enhanced Visibility
Partnering with the right 3PL can give brands access to robust inventory analytics across multiple fulfillment centers. 3PL analytics platforms provide real-time data that helps track stock movement, monitor trends, and make informed decisions without being tied to a single location.
Key Features to Look For:
- Inventory Snapshots: Track daily SKU movements across all centers to spot discrepancies and imbalances.
- Inventory Velocity Reports: Calculate daily turnover and days on hand to optimize reorder points and prevent stockouts.
- ERP Integrations: Feed 3PL data into systems like NetSuite or QuickBooks for a unified view of inventory, sales, and forecasting.
- Multi-Warehouse Visibility: Respond quickly to regional demand shifts, reduce shipping costs, and maintain service levels across DTC, B2B, and marketplace channels.
- Insights & Reporting: Gain actionable metrics on SKU performance, fulfillment efficiency, and turnover to reduce waste and shrinkage.
Leveraging 3PL analytics gives businesses real-time control over inventory at all locations, ensuring products are available when customers need them while reducing manual reporting burdens and supporting scalable operations.
For help selecting the best 3PL partner, see our 2026 guide on finding the right 3PL for your business.
Best Practices to Minimize Errors, Shrinkage, and Waste
Even seemingly small inefficiencies can add up — losing just 1–2% of inventory can have a notable impact on retail margins, especially for fast-moving ecommerce and CPG brands. Staying on top of inventory requires systematic processes and leveraging real-time data to catch problems early. Consider these best practices:
- Implement consistent counting and reconciliation routines: Schedule regular inventory audits across all warehouses and channels to maintain accurate stock records.
- Combine weekly spot checks with monthly full counts: Focus weekly checks on your highest-selling SKUs and perform comprehensive monthly audits, reconciling results with turnover or snapshot reports to ensure precision.
- Track inventory at the SKU and location level: Monitoring stock per fulfillment center helps uncover regional demand trends, prevents imbalances, and informs smarter allocation decisions.
- Follow FIFO/FEFO for perishables and seasonal items: Ensure older stock sells first, mark items approaching expiration, and keep seasonal inventory moving before it loses value.
- Automate replenishment where possible: Set reorder thresholds and lead times to automatically trigger restocking, avoiding last-minute orders or emergency shipments.
- Review discrepancies between expected and actual picks: Regularly compare what should be shipped versus what was picked to catch errors, theft, or mispicks quickly.
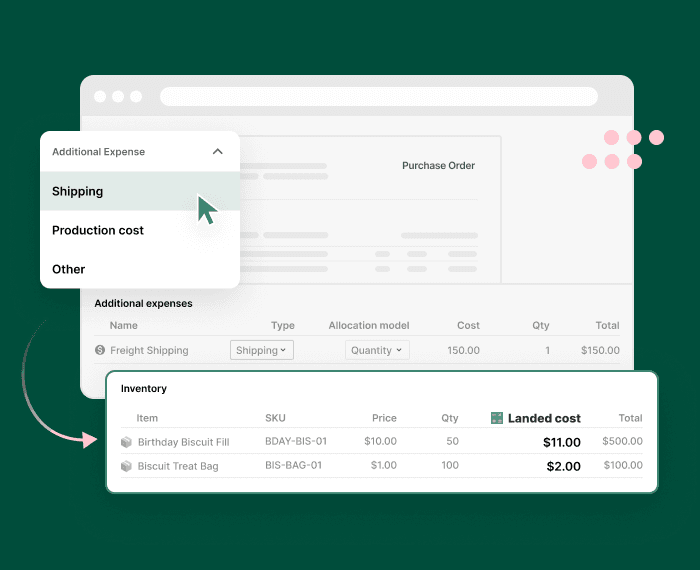
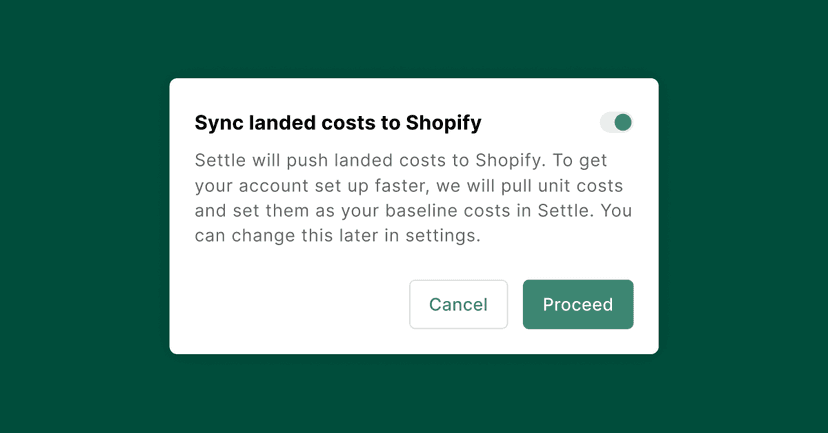
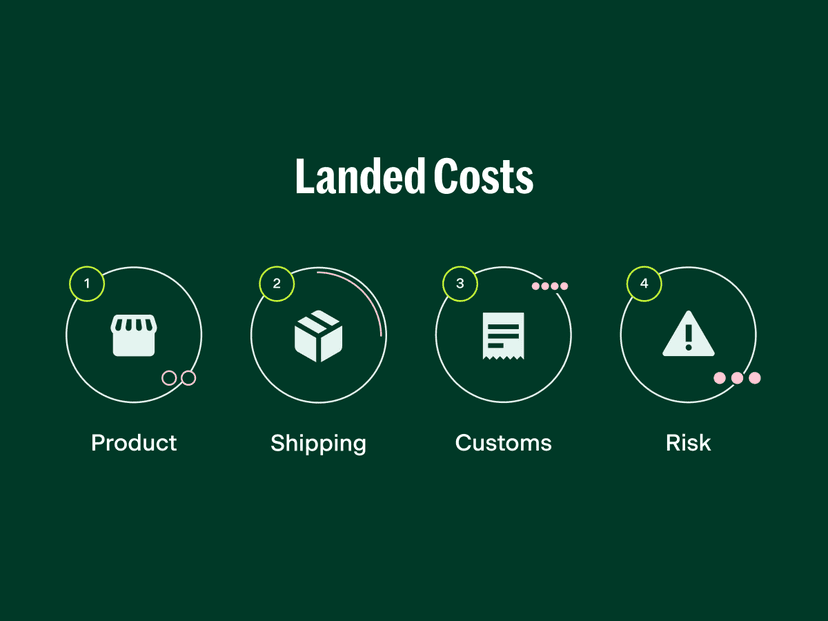
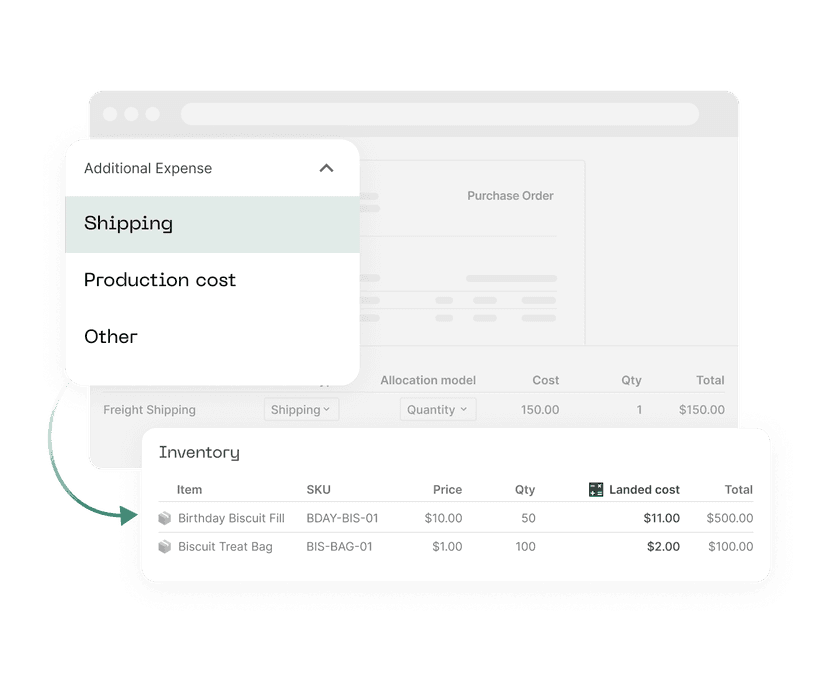
Pro Tip: Leveraging real-time inventory turnover, accurate landed costs, and automated COGS tracking through platforms like Settle allows brands to identify unusual consumption trends and potential losses proactively. Coupled with standardized counting procedures, this approach protects margins, keeps products available for customers, and reduces unnecessary stock buildup, helping businesses scale efficiently.
Leverage Inventory Turnover Insights for Growth
Accurate inventory turnover isn’t just a day-to-day operational metric — it can drive strategic business decisions. Monitoring stock movement on a daily, weekly, and seasonal basis enables ecommerce and CPG brands to make smarter choices across finance, fulfillment, and expansion.
- Enhance forecasting and budgeting: Analyzing 30-day turnover trends sharpens demand predictions, prevents overstock, and safeguards cash flow.
- Unlock working capital: Identify exactly how much inventory is required and redirect surplus cash into marketing, product launches, or new growth initiatives.
- Streamline global inventory placement: Efficiently distribute stock across warehouses to reduce transit times and cut shipping costs.Plan promotions and sales channels with confidence: Historical turnover patterns reveal peak demand periods, minimizing the risk of stockouts.
- Manage multi-channel risk: Ensure inventory levels align with service-level agreements, marketplace requirements, and B2B commitments.
Recommended Solution:
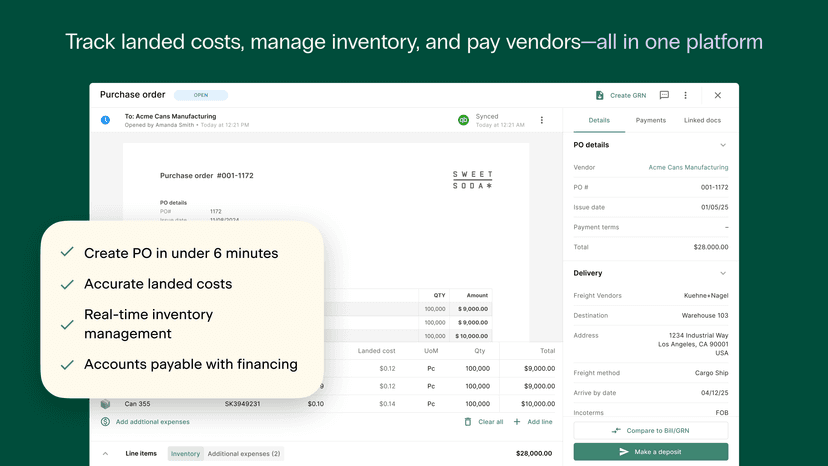
Settle offers a comprehensive platform for ecommerce and CPG businesses, integrating real-time inventory tracking, purchase order management, analytics dashboards, embedded payments, and automated demand forecasting. By connecting operational and financial workflows, Settle helps brands save 10-20 hours per month and up to $200,000 annually by reducing manual tasks, improving margin visibility, and freeing teams to focus on growth rather than spreadsheets. Brands can also leverage purchase order financing to access working capital for expansion without overextending their balance sheet. Talk to a Settle product expert today.